"""
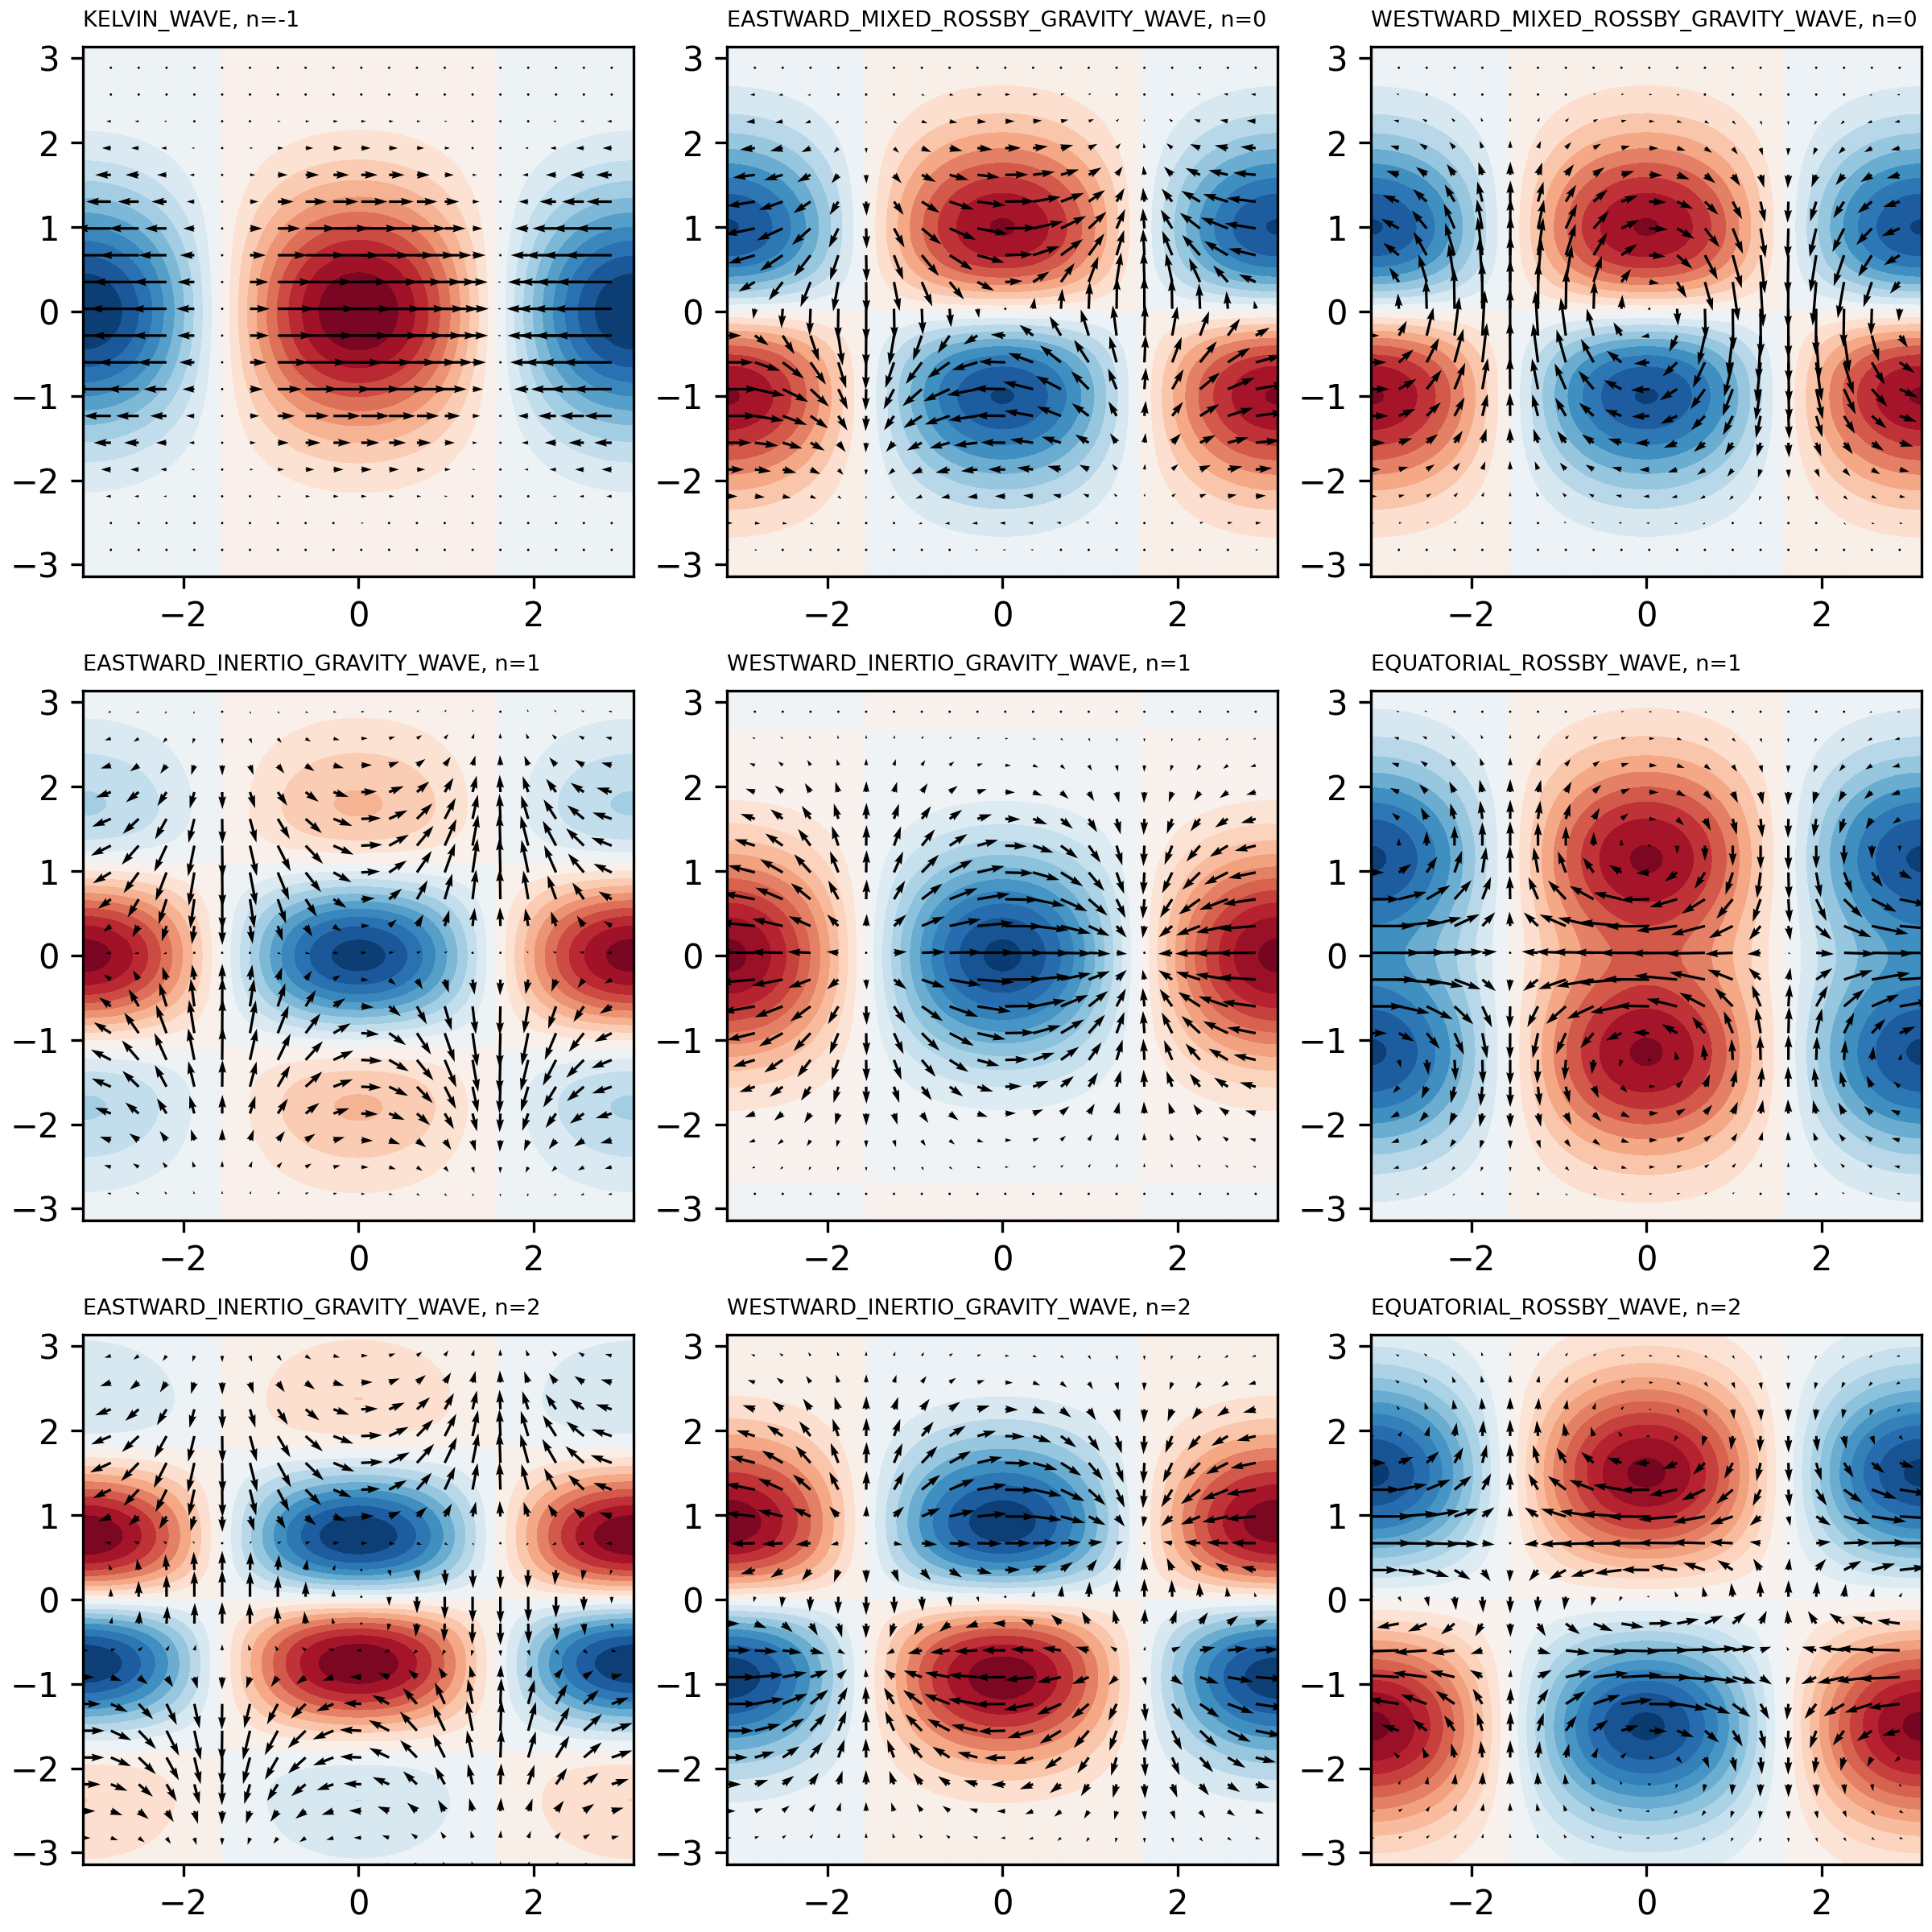
绘制不同赤道波的无量纲空间分布图
"""
import numpy as np
from matplotlib import pyplot as plt
import moisten_ew as mew

# 设置画图的波动类型与 n
waves = [
    [mew.EquatorialWave.KELVIN_WAVE, -1],
    [mew.EquatorialWave.EMRGW, 0],
    [mew.EquatorialWave.WMRGW, 0],
    [mew.EquatorialWave.EIGW, 1],
    [mew.EquatorialWave.WIGW, 1],
    [mew.EquatorialWave.ERW, 1],
    [mew.EquatorialWave.EIGW, 2],
    [mew.EquatorialWave.WIGW, 2],
    [mew.EquatorialWave.ERW, 2],
]


# 无量纲下的空间坐标

x = np.linspace(-np.pi, np.pi, 100)
y = np.linspace(-np.pi, np.pi, 100)


fig = plt.figure(figsize=(8, 8), constrained_layout=True)
gs = fig.add_gridspec(3, 3)

for i, (wave, n) in enumerate(waves):
    ax = fig.add_subplot(gs[i//3, i % 3])

    # 计算变量分布
    u, v, phi = mew.wave_distribution_dimensionless(
        wave, x, y, t=0, wavenumber=1, n=n,
    )

    ax.contourf(x, y, phi, levels=20, cmap='RdBu_r')
    ax.quiver(
        x[::5], y[::5], u[::5, ::5], v[::5, ::5],
        units='xy', width=0.03
    )
    ax.set_title(f'{wave.name}, n={n}', loc='left', fontsize=6.5)

fig.savefig("docs/images/wave_dist.png", dpi=300)