"""
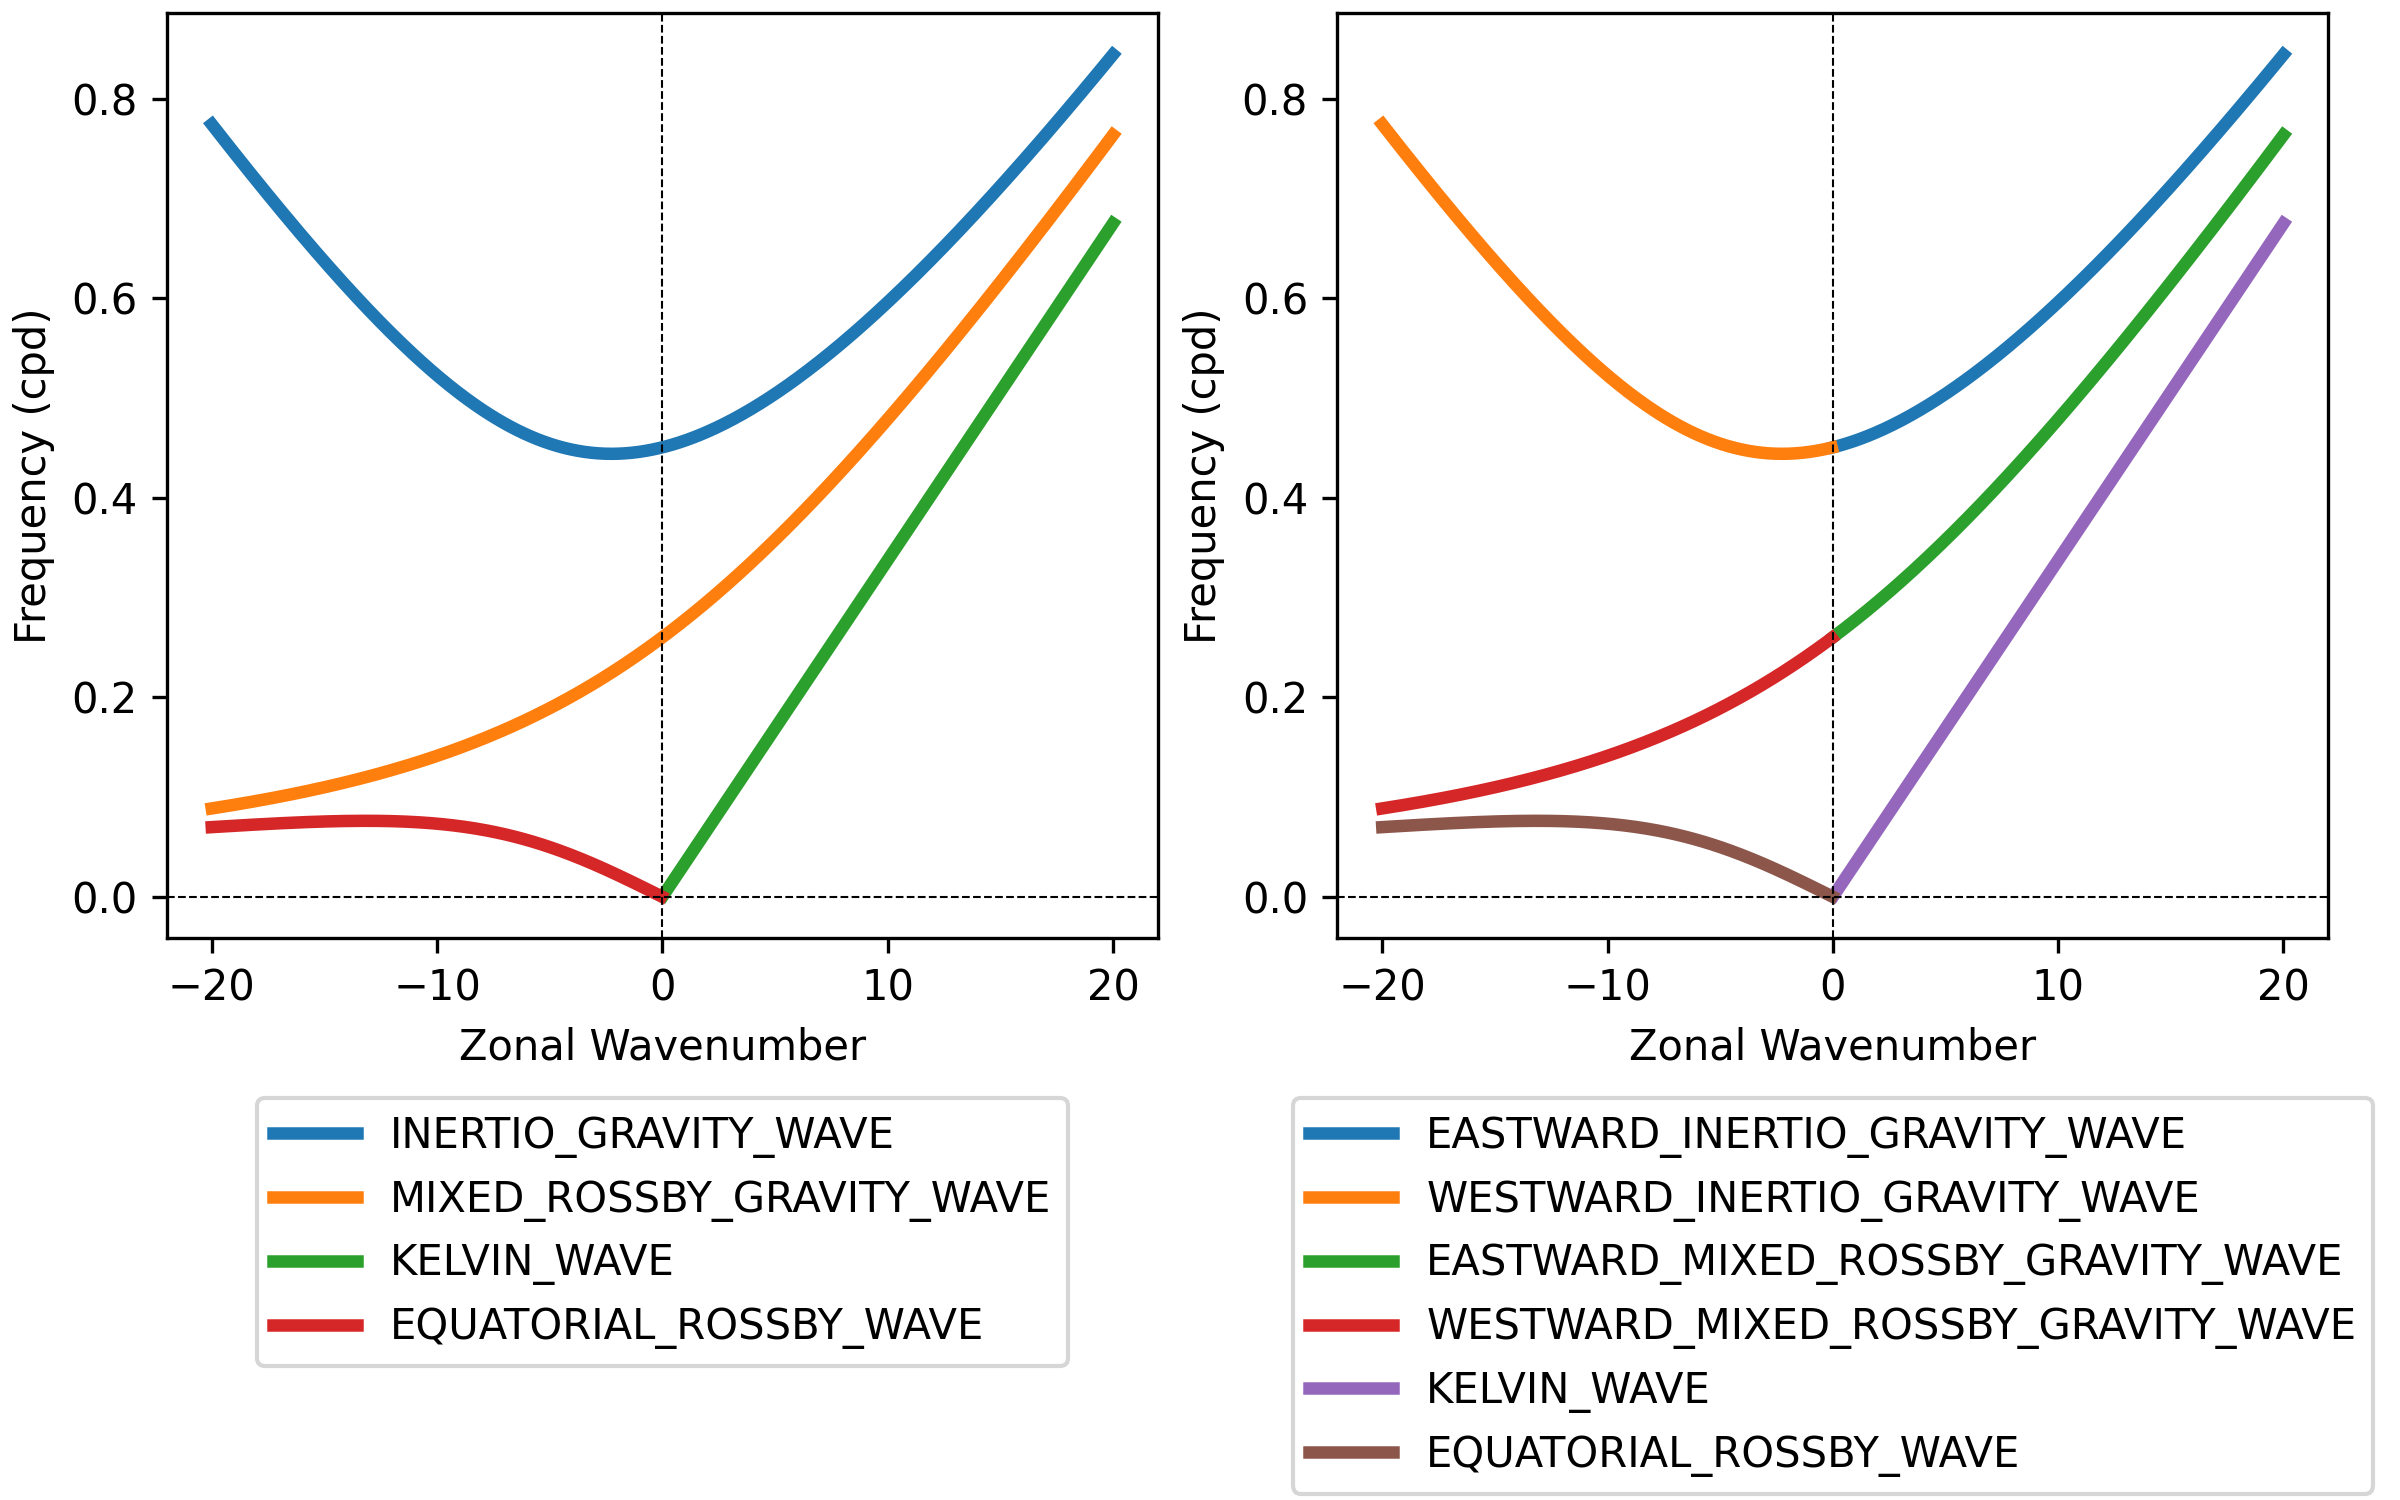
画热带波动的频散曲线
"""

import numpy as np
from matplotlib import pyplot as plt
import moisten_ew as mew

# 设置波数范围
wavenumber = np.linspace(-20, 20, 400) * mew.unit('zonal_wavenumber')

# 不分传播方向的波动类型
waves_1 = [
    mew.EquatorialWave.IGW,
    mew.EquatorialWave.MRGW,
    mew.EquatorialWave.KELVIN_WAVE,
    mew.EquatorialWave.ERW
]

# 区分传播方向的波动类型
waves_2 = [
    mew.EquatorialWave.EIGW,
    mew.EquatorialWave.WIGW,
    mew.EquatorialWave.EMRGW,
    mew.EquatorialWave.WMRGW,
    mew.EquatorialWave.KELVIN_WAVE,
    mew.EquatorialWave.ERW,
]

fig = plt.figure(figsize=(8, 5), constrained_layout=True)


for i, waves in enumerate([waves_1, waves_2]):
    ax = fig.add_subplot(121 + i)

    for wave in waves:
        # 计算有量纲角频率
        omega = mew.angular_frequency(
            wave, wavenumber, n=1, equivalent_depth=25
        )

        # 转为频率
        freq = omega/(2*np.pi)  # from rad/day to 1/day

        ax.plot(
            wavenumber, freq, label=wave.name, lw=3
        )
    ax.axhline(0, color='k', lw=0.5, ls='--')
    ax.axvline(0, color='k', lw=0.5, ls='--')
    ax.set_xlabel('Zonal Wavenumber')
    ax.set_ylabel('Frequency (cpd)')
    ax.legend(loc='upper center', bbox_to_anchor=(0.5, -0.15), )

fig.savefig("docs/images/dispersion.png", dpi=300)